2011 Weather Summary And A Winter Forecast Performance Review
The final two weeks of December had the potential to create some winter weather in our area. Unfortunately we missed out on both opportunities as the systems slid south and east of Oshkosh. While the new year brought a needed taste of winter, the first half of January will trend back towards the lack luster winter weather we saw most of December. The forecast trend is based on Lezak's Recurring Cycle theory and can be found on the OSNW3 LRC blog. A performance review of the LRC based Oshkosh winter predictions I made back in November for the 'first cycle' are located farther down in this entry. The climatology summary for Decemeber is below and the summary for January can be found here.
(OSNW3 Weather Brief)
(OSNW3 December Observations)
(OSNW3 December 2011 Summary)
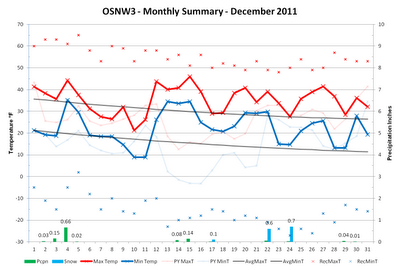 (click on graph for the month summary data - it will open a new tab/window)
----
Is It Winter Yet?
Nope, not by the standards we follow here at OSNW3. The definition of a 'Winter Season' is based on two distinct events. One, the First Day of Winter which represents a daily max temp equal or below 32°F and a snow depth of 1" or greater for several consecutive days. Two, the Last Day of Winter which represents a daily max temp equal or above 32°F and a snow depth less than 1" for several consecutive days. In the case of OSNW3, six(6), is used for "several" consecutive days. Below is a listing of the past five winters. Click on the years to see it in a graph.
2006-2007 lasted 62 days, Jan-20 through Mar-22
2007-2008 lasted 112 days, Dec-9 through Mar-29
2008-2009 lasted 101 days, Dec-10 through Mar-20
2009-2010 lasted 95 days, Dec-12 through Mar-16
2010-2011 lasted 95 days, Dec-18 through Mar-22
2011-2012 has not started.
----
Oshkosh Winter Prediction - Cycle 1 Performance Review
How is the winter forecast based on the LRC performing as we begin a new cycle? I will admit my thinking in November was that long term climatology would prevail and not become the preventing factor in snow production as it has been thus far. The much advertised 'split flow jet' and 'bottled up AO' are the culprits in busting my snowy predictions this cycle. As for temperatures, however, the prediction of a warmer than average winter is steadfast. Overall the middle of the atmosphere keeps on the cycling and we can look forward to the 2011-12 LRC feature patterns again and again. Below are some numbers to quantify the first cycle forecast performance.
Prediction
Days with Measurable Snow (0.1" or greater)
Cycle 1 = 13 days (Nov-16 thru Jan-2)
- Actual
- 5 days with 0.1" or greater snowfall.
- 14 days with Trace or greater snowfall.
- 38% accuracy
Prediction
Total Snow Accumulation
Cycle 1 = 16 inches of snow (Nov-16 thru Jan-2)
- Actual
- 2.4 inches of snow
- 2.18 inches of precipitation. A 10:1 snow to water ratio would have equaled 21 inches of snow had it all been snow.
- 15% accuracy
Prediction
Temperatures
The data trend leads me to believe that there will be enough warm spells to compensate for the majority of cold air events within each cycle leading to Above Average temperatures for the winter. The numbers tell me 1 to 3 degrees above average each cycle. Don't get me wrong, there will be some cold stretches this winter, there is no doubt about it, but with warm-ups scattered about may make the overall winter not seem so harsh temperature wise.
- Actual
- Daily Maximum temperatures are currently 4.5 degrees above the (81-10) 30 year average.
What should we expect in Cycle 2? The trends show a mild start to January with a cool down by the end of the month. February should continue with what we saw in much of December but hopefully this time around most of the precipitation will fall as snow. The most recent snowfall and wind event (Jan 1-2) should recur sometime around Feb-17. Sticking with the original forecast made back in November for this cycle, we should expect about 12 days with measurable snowfall accumulating around 17 inches. Temperatures should stay above average for the cycle once again. For an idea of when the precipitation may occur see the OSNW3 LRC Calendar 2011-12 and follow the blue highlighted dates. Remember to give or take a day!
----
OSNW3 2011 Summary
OSNW3 ended 2011 0.3 degrees below the Oshkosh long term annual mean temperature average (1981-2010) and 5.45 inches above the precipitation average. We recorded more cloudy days and less clear days compared to 2010. Interestingly we recorded the exact same amount of thunderstorms in 2011 as we did in 2010. Below is a month by month summary. Click here for the annual summary.
-
January :: The air was seasonal with average temperatures. Oshkosh endured one cold snap that recorded all of the below zero lows for the month. An astounding 23 of the 31 days saw a Trace or more of snowfall but the month only tallied 1.4 inches above average snowfall. The largest 24hr snowfall was 2.7 inches.
February :: More average temperatures with another short lived cold spell in the middle of the month followed by a significant warm-up. Snowfall was 13.8 inches above average. A routine LRC precipitation event turned into a *surprise snowstorm*.
March :: The start of meteorological spring brought typical late winter conditions to Oshkosh. Temperatures hovered slightly below average helping the snowpack stick around. Mid month saw a warm-up that raised max temperatures into the 50's. The fourth recurrence of the Great Lakes Cyclone (the 2010-11 LRC 'signature' storm) rewrote all the early spring notions however. The snow and cold of winter lingered into April. Monthly temperatures ended below average and snowfall ended above average.
April :: The first half of the month saw typical April type weather with many ups and downs due to a volatile atmosphere. With that came severe weather; hail, thundersnow, and a record tornado outbreak in NE WI. The thundersnow was accompanied by a top ten 24hr snowfall late in the month for Oshkosh in the month of April.
May :: A cooler than average month with three distinct warm ups and cool downs. Each warm-up raised the mercury above 80 degrees which each cool-down lowered the mercury below 40 degrees. Precipitation was below average even though the month ended with two extra days of measurable precipitation from the average.
June :: A hot start to the month was followed by an extreme cool down which lasted for the majority of the month. Precipitation was almost an inch above average. Six thunderstorms rumbled through. One brightened the evening sky with Mammatus. Highest maximum daily temperature was 93.5 degrees.
July :: The month that was a 'dog day of summer'. It was an extended heat wave that included only two very short lived periods of relief. Only one night experienced a low temperature below 60°F. Highest maximum daily temperature was 93.3 degrees. The month rendered 8 thunderstorms.
August :: Dry. Zero overcast days. The month ended 2.68 inches below average with 10 days of measurable precipitation. Maximum temperatures topped 80 degrees 16 times.
September :: The dry trends of August continued into September where 13 consecutive days recorded no measurable precipitation. The dry spell snapped however, as 10 of the 12 final days of the month recorded measurable precipitation. Near the end of the month the region was tightly wrapped in a stationary cut-off low pressure system which ushered in autumn like weather capping the seasonal downward spiral of average temperatures.
October :: A very windy start to the month wreaking havoc around the region. Door County was hit especially hard experiencing winds in excess of 60mph. After the lion like start things moderated into an Indian summer. Autumn finally set in mid month allowing a very colorful display to unfold. Dry days and cool nights ended the month.
November :: A typical transition month feel with rollercoaster temperatures leading to sporadic bouts with precipitation and an early season snowfall. Temperatures ended 2 degrees above average and precipitation 2.60 inches above average.
December :: Snow drought. December 2011 ranks 18th all-time least snowiest for Oshkosh. Temperatures ended 6 degrees above average and OSNW3 recorded the least amount of precipitation in December since genesis. There was a bright spot for snow enthusiasts during the mild and mainly snowless month however. Lake Effect Snow off of Lake Winnebago!
----
Front Of House
Snow! It likely will not stick around all that long.
(FOH - Jan 2, 2012)

(OSNW3 Weather Brief)
(OSNW3 December Observations)
(OSNW3 December 2011 Summary)
----
Is It Winter Yet?
Nope, not by the standards we follow here at OSNW3. The definition of a 'Winter Season' is based on two distinct events. One, the First Day of Winter which represents a daily max temp equal or below 32°F and a snow depth of 1" or greater for several consecutive days. Two, the Last Day of Winter which represents a daily max temp equal or above 32°F and a snow depth less than 1" for several consecutive days. In the case of OSNW3, six(6), is used for "several" consecutive days. Below is a listing of the past five winters. Click on the years to see it in a graph.
2006-2007 lasted 62 days, Jan-20 through Mar-22
2007-2008 lasted 112 days, Dec-9 through Mar-29
2008-2009 lasted 101 days, Dec-10 through Mar-20
2009-2010 lasted 95 days, Dec-12 through Mar-16
2010-2011 lasted 95 days, Dec-18 through Mar-22
2011-2012 has not started.
----
Oshkosh Winter Prediction - Cycle 1 Performance Review
How is the winter forecast based on the LRC performing as we begin a new cycle? I will admit my thinking in November was that long term climatology would prevail and not become the preventing factor in snow production as it has been thus far. The much advertised 'split flow jet' and 'bottled up AO' are the culprits in busting my snowy predictions this cycle. As for temperatures, however, the prediction of a warmer than average winter is steadfast. Overall the middle of the atmosphere keeps on the cycling and we can look forward to the 2011-12 LRC feature patterns again and again. Below are some numbers to quantify the first cycle forecast performance.
Prediction
Days with Measurable Snow (0.1" or greater)
Cycle 1 = 13 days (Nov-16 thru Jan-2)
- Actual
- 5 days with 0.1" or greater snowfall.
- 14 days with Trace or greater snowfall.
- 38% accuracy
Prediction
Total Snow Accumulation
Cycle 1 = 16 inches of snow (Nov-16 thru Jan-2)
- Actual
- 2.4 inches of snow
- 2.18 inches of precipitation. A 10:1 snow to water ratio would have equaled 21 inches of snow had it all been snow.
- 15% accuracy
Prediction
Temperatures
The data trend leads me to believe that there will be enough warm spells to compensate for the majority of cold air events within each cycle leading to Above Average temperatures for the winter. The numbers tell me 1 to 3 degrees above average each cycle. Don't get me wrong, there will be some cold stretches this winter, there is no doubt about it, but with warm-ups scattered about may make the overall winter not seem so harsh temperature wise.
- Actual
- Daily Maximum temperatures are currently 4.5 degrees above the (81-10) 30 year average.
What should we expect in Cycle 2? The trends show a mild start to January with a cool down by the end of the month. February should continue with what we saw in much of December but hopefully this time around most of the precipitation will fall as snow. The most recent snowfall and wind event (Jan 1-2) should recur sometime around Feb-17. Sticking with the original forecast made back in November for this cycle, we should expect about 12 days with measurable snowfall accumulating around 17 inches. Temperatures should stay above average for the cycle once again. For an idea of when the precipitation may occur see the OSNW3 LRC Calendar 2011-12 and follow the blue highlighted dates. Remember to give or take a day!
----
OSNW3 2011 Summary
OSNW3 ended 2011 0.3 degrees below the Oshkosh long term annual mean temperature average (1981-2010) and 5.45 inches above the precipitation average. We recorded more cloudy days and less clear days compared to 2010. Interestingly we recorded the exact same amount of thunderstorms in 2011 as we did in 2010. Below is a month by month summary. Click here for the annual summary.
-
January :: The air was seasonal with average temperatures. Oshkosh endured one cold snap that recorded all of the below zero lows for the month. An astounding 23 of the 31 days saw a Trace or more of snowfall but the month only tallied 1.4 inches above average snowfall. The largest 24hr snowfall was 2.7 inches.
February :: More average temperatures with another short lived cold spell in the middle of the month followed by a significant warm-up. Snowfall was 13.8 inches above average. A routine LRC precipitation event turned into a *surprise snowstorm*.
March :: The start of meteorological spring brought typical late winter conditions to Oshkosh. Temperatures hovered slightly below average helping the snowpack stick around. Mid month saw a warm-up that raised max temperatures into the 50's. The fourth recurrence of the Great Lakes Cyclone (the 2010-11 LRC 'signature' storm) rewrote all the early spring notions however. The snow and cold of winter lingered into April. Monthly temperatures ended below average and snowfall ended above average.
April :: The first half of the month saw typical April type weather with many ups and downs due to a volatile atmosphere. With that came severe weather; hail, thundersnow, and a record tornado outbreak in NE WI. The thundersnow was accompanied by a top ten 24hr snowfall late in the month for Oshkosh in the month of April.
May :: A cooler than average month with three distinct warm ups and cool downs. Each warm-up raised the mercury above 80 degrees which each cool-down lowered the mercury below 40 degrees. Precipitation was below average even though the month ended with two extra days of measurable precipitation from the average.
June :: A hot start to the month was followed by an extreme cool down which lasted for the majority of the month. Precipitation was almost an inch above average. Six thunderstorms rumbled through. One brightened the evening sky with Mammatus. Highest maximum daily temperature was 93.5 degrees.
July :: The month that was a 'dog day of summer'. It was an extended heat wave that included only two very short lived periods of relief. Only one night experienced a low temperature below 60°F. Highest maximum daily temperature was 93.3 degrees. The month rendered 8 thunderstorms.
August :: Dry. Zero overcast days. The month ended 2.68 inches below average with 10 days of measurable precipitation. Maximum temperatures topped 80 degrees 16 times.
September :: The dry trends of August continued into September where 13 consecutive days recorded no measurable precipitation. The dry spell snapped however, as 10 of the 12 final days of the month recorded measurable precipitation. Near the end of the month the region was tightly wrapped in a stationary cut-off low pressure system which ushered in autumn like weather capping the seasonal downward spiral of average temperatures.
October :: A very windy start to the month wreaking havoc around the region. Door County was hit especially hard experiencing winds in excess of 60mph. After the lion like start things moderated into an Indian summer. Autumn finally set in mid month allowing a very colorful display to unfold. Dry days and cool nights ended the month.
November :: A typical transition month feel with rollercoaster temperatures leading to sporadic bouts with precipitation and an early season snowfall. Temperatures ended 2 degrees above average and precipitation 2.60 inches above average.
December :: Snow drought. December 2011 ranks 18th all-time least snowiest for Oshkosh. Temperatures ended 6 degrees above average and OSNW3 recorded the least amount of precipitation in December since genesis. There was a bright spot for snow enthusiasts during the mild and mainly snowless month however. Lake Effect Snow off of Lake Winnebago!
----
Front Of House
Snow! It likely will not stick around all that long.
(FOH - Jan 2, 2012)

That snow of "yours" is looking really good. Early next week we should see some here. A real flop of a winter thus far...
ReplyDeleteI am enjoying Bob. It's a great landscape. I've missed it. Winter has been unique so far!
ReplyDelete